Optimize Pipeline Operations with Drag Reducing Agents and Pump Configurations
Let’s Work Together
Call us directly, submit a sample or email us!
Address Business
Ocean tower 2, Unit 23 floor, 75/46 Soi Sukhumvit 19 (Wattana), Sukhumvit Road, North Klongtoey, Wattana, Bangkok 10110
Contact Us
Call : +66994200465 |
+66 2 258 6228
Email : info@techcurve.co | sales@techcurve.co
+66 2 258 6228
Email : info@techcurve.co | sales@techcurve.co
Working Time
Monday – Friday
8:30hrs – 17:30hrs
8:30hrs – 17:30hrs
Company Background
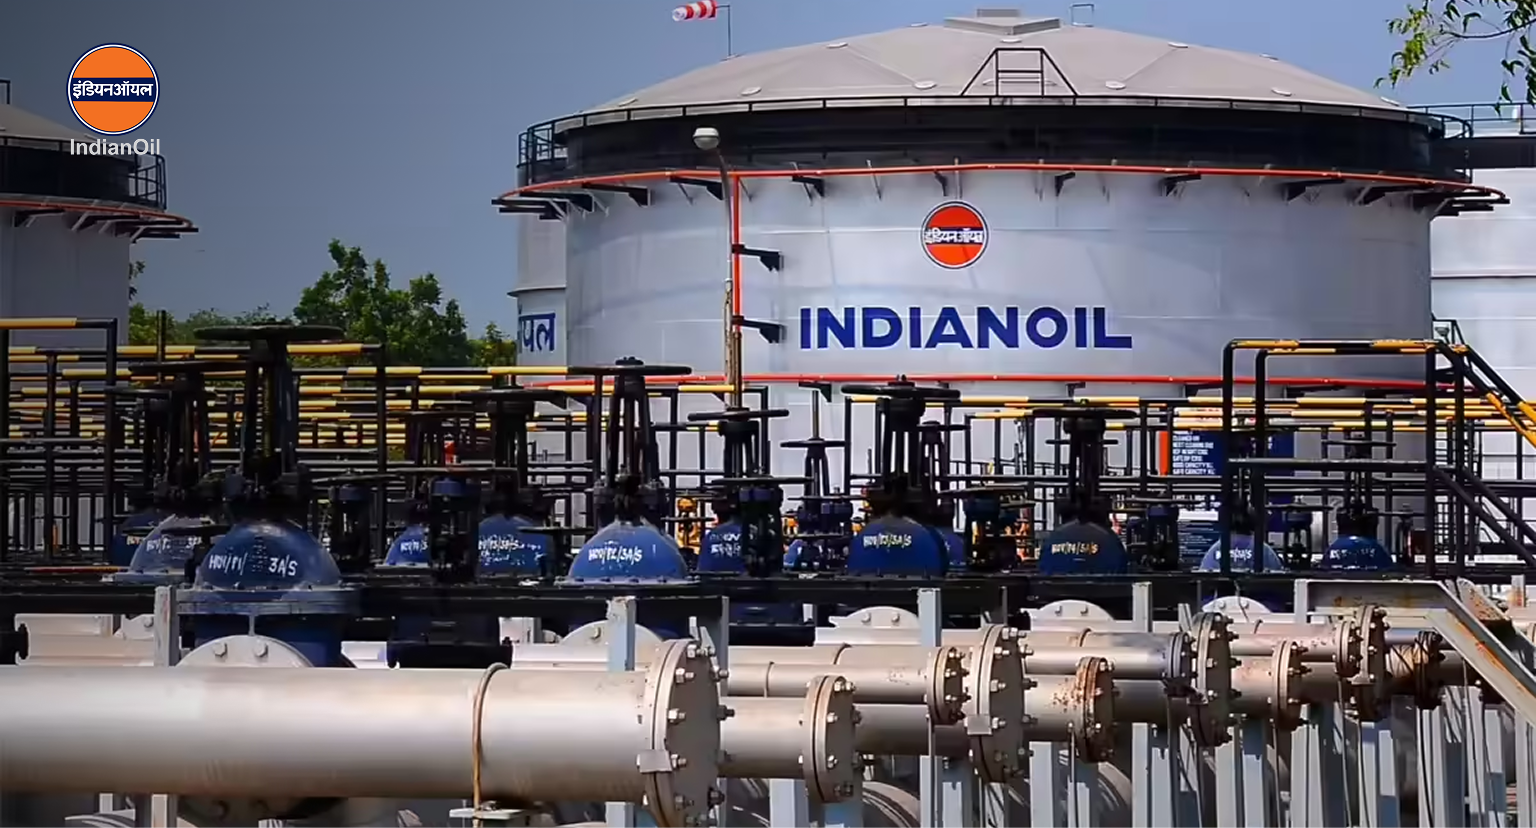
Indian Oil Corporation Limited (IOCL) is India’s largest downstream oil company,
operating extensive multi-product hydrocarbon pipeline networks that transport fuels across long distances and multiple pumping stations.
These pipelines are strategic national assets where energy efficiency, throughput reliability, and operating cost control are critical to meeting growing fuel demand while supporting sustainability commitments.
Challenges
IOCL operates multi-segment, batch-based pipelines where each batch varies in:
- Density
- Viscosity
- Flow rate requirements
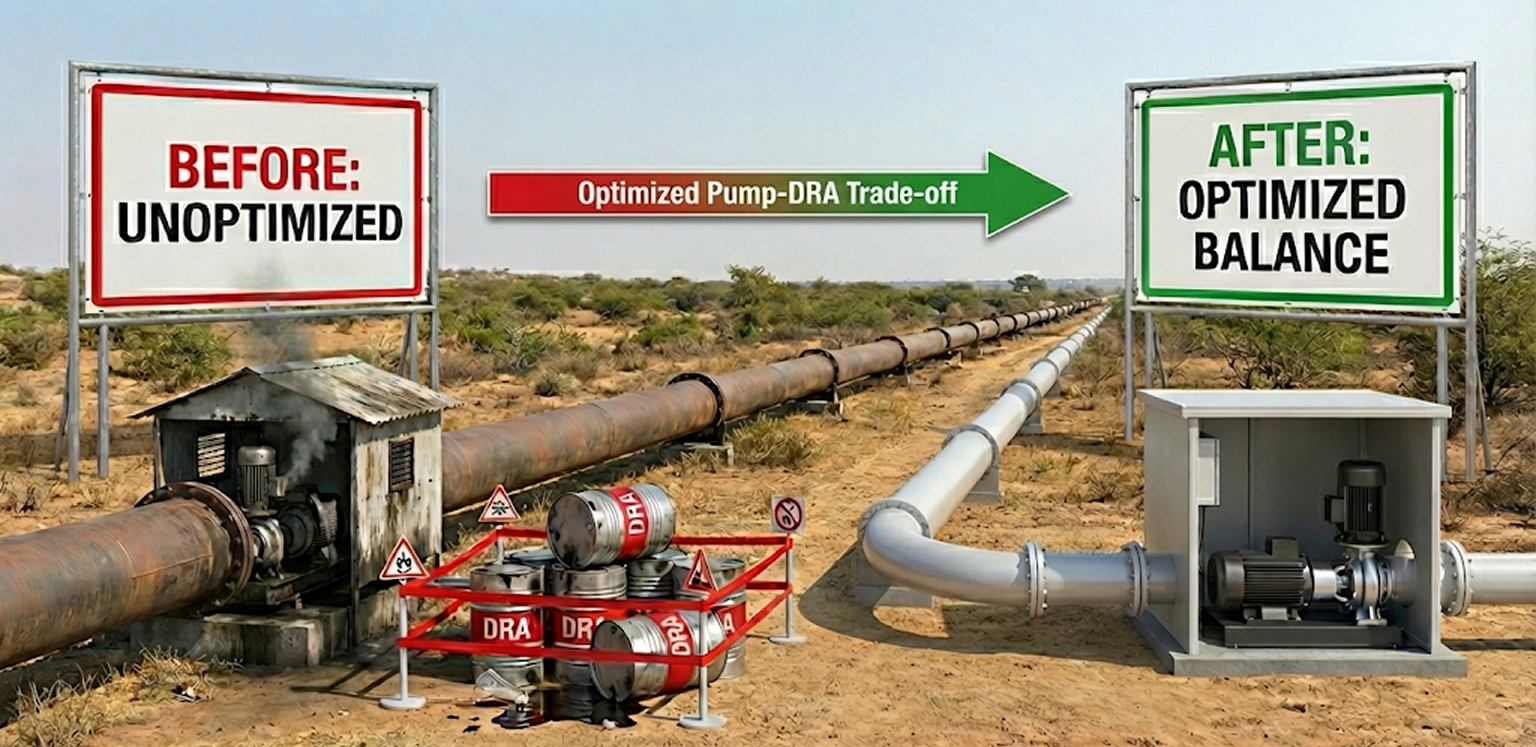
- Inefficient pump configurations driven by rule-of-thumb decisions
- Overuse or underuse of Drag Reducing Agents (DRA)
- Excessive power consumption from over-pumping
- Risk of insufficient head pressure affecting batch interfaces
- Manual hydraulic calculations performed offline
- Data fragmented across multiple pipeline and station historians
Solution
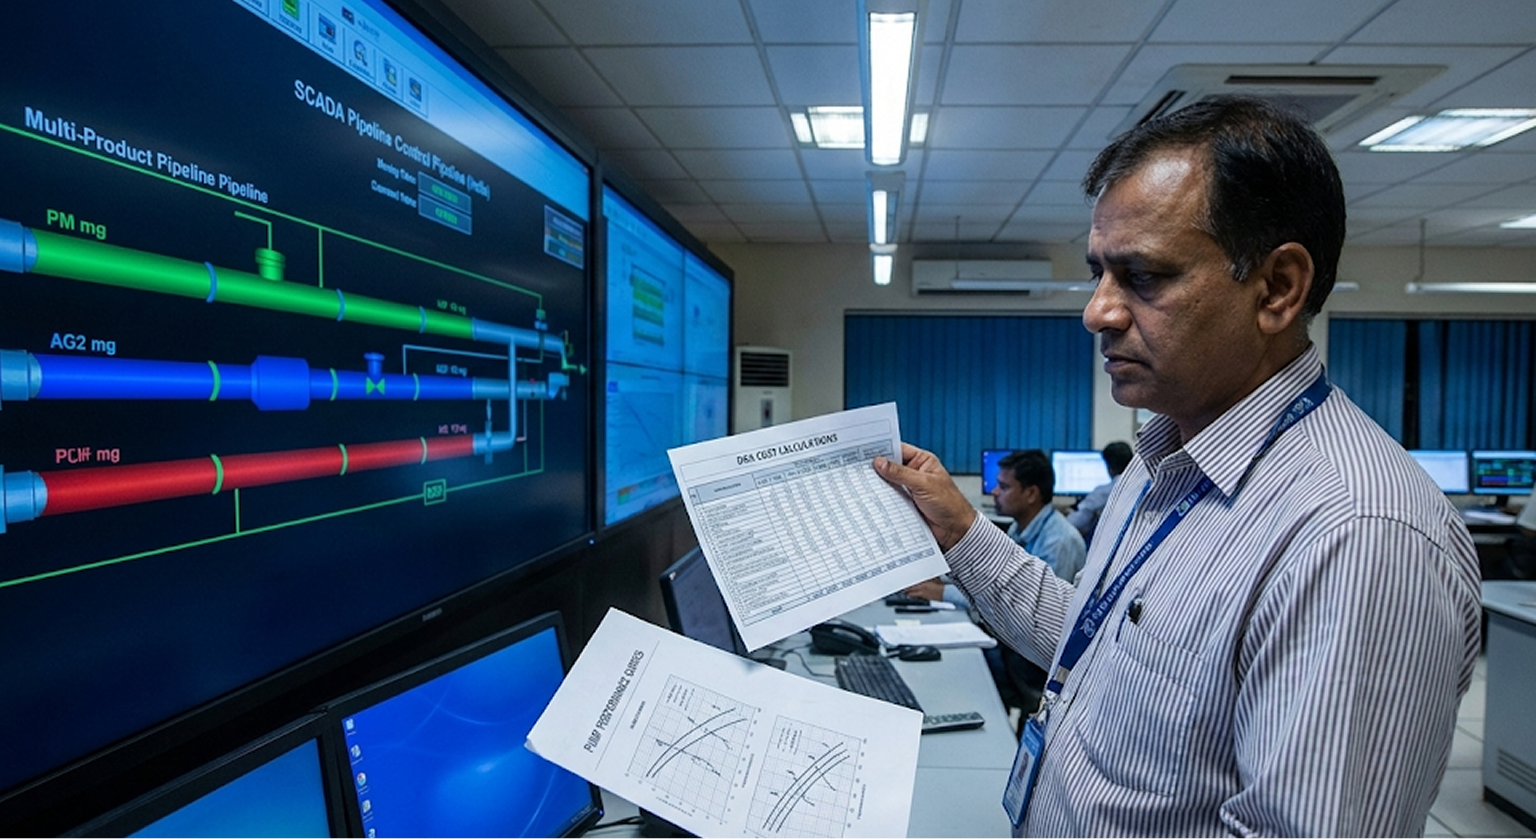
IOCL implemented an integrated pipeline optimization framework using Seeq by connecting
multiple process historians across pipeline segments and pumping stations.
1. Historian Integration
Operational data streamed into Seeq included:
1. Historian Integration
Operational data streamed into Seeq included:
- Batch volumes, densities, and viscosities
- Flow rates and pipeline segment hydraulics
- Pump speeds (RPM), power draw, and availability
- DRA injection rates
- Station-level pressure and head data
2. Self-Service Pipeline Analytics
Using Seeq Workbench and Seeq Datalabs, pipeline SMEs independently built and maintained optimization logic without reliance on external data science teams. Self-service analytics included:
Using Seeq Workbench and Seeq Datalabs, pipeline SMEs independently built and maintained optimization logic without reliance on external data science teams. Self-service analytics included:
- Hydraulic head calculations by pipeline segment
- Pump performance curve overlays to assess feasible pump combinations
- Identification of under-capacity and over-capacity scenarios
- Batch-specific evaluation of single, dual, or triple pump configurations
- Energy cost from pump power consumption
- Chemical cost from DRA injection
- RPM reduction opportunities in over-capacity scenarios
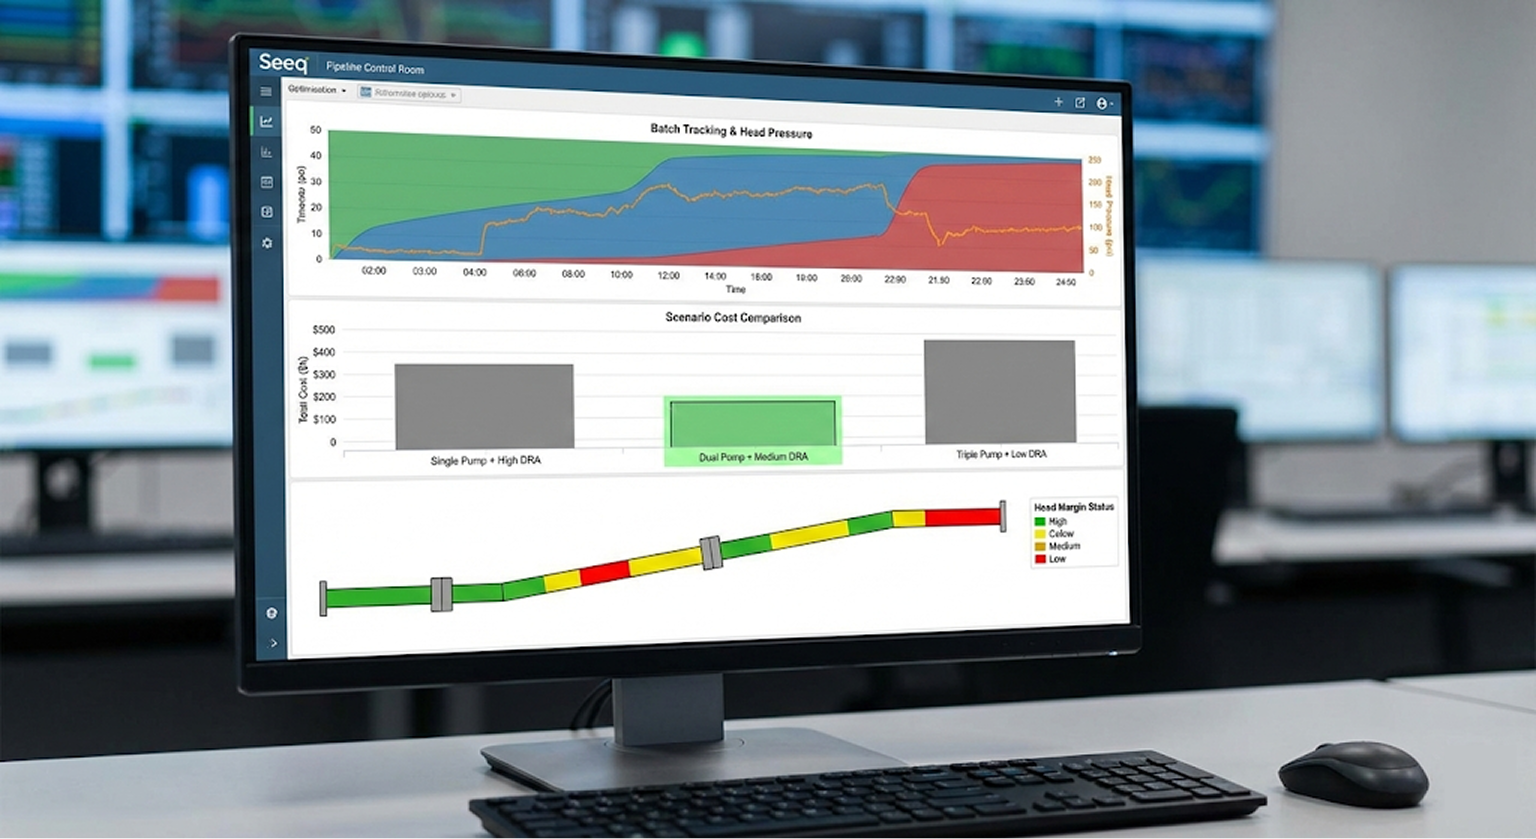
- Head balance bar charts
- Cost breakdown comparisons
- Pump utilization visualizations
Benefits
Operational Efficiency
- Optimized pump configurations per batch
- Reduced over-pumping and energy waste
- Faster, data-driven pipeline scheduling decisions
Financial Performance
- Reduced energy and DRA chemical consumption
- Improved utilization of existing pumping infrastructure
- Lower total cost per batch transported
- Reduced electricity consumption across pumping stations
- Lower CO₂ emissions from optimized RPM and pump usage
- Improved alignment with energy efficiency goals
- Eliminated spreadsheet-based hydraulic analysis
- Enabled true self-service optimization by pipeline engineers
- Created auditable, repeatable decision workflows
Cost Saving
In the pipeline application, this approach enabled evaluation of 25+ operating scenarios per batch, identifying optimal DRA dosages and pump configurations that delivered double-digit percentage reductions in operating cost while reducing emissions.
To understand the detailed cost-saving model — including energy reduction, DRA optimization, and annualized financial impact — connect with us to review the pipeline-specific cost assessment framework.
To understand the detailed cost-saving model — including energy reduction, DRA optimization, and annualized financial impact — connect with us to review the pipeline-specific cost assessment framework.