Company Background – SYS
Digital Geometric Profiling & Dimensional Root Cause Analytics
Siam Yamato Steel Co., Ltd. (SYS) manufactures structural H-beams and heavy sections used in major infrastructure and building projects. In structural steel production, dimensional accuracy is mission-critical — even small geometric deviations can result in non-compliance, rework, or rejected shipments.
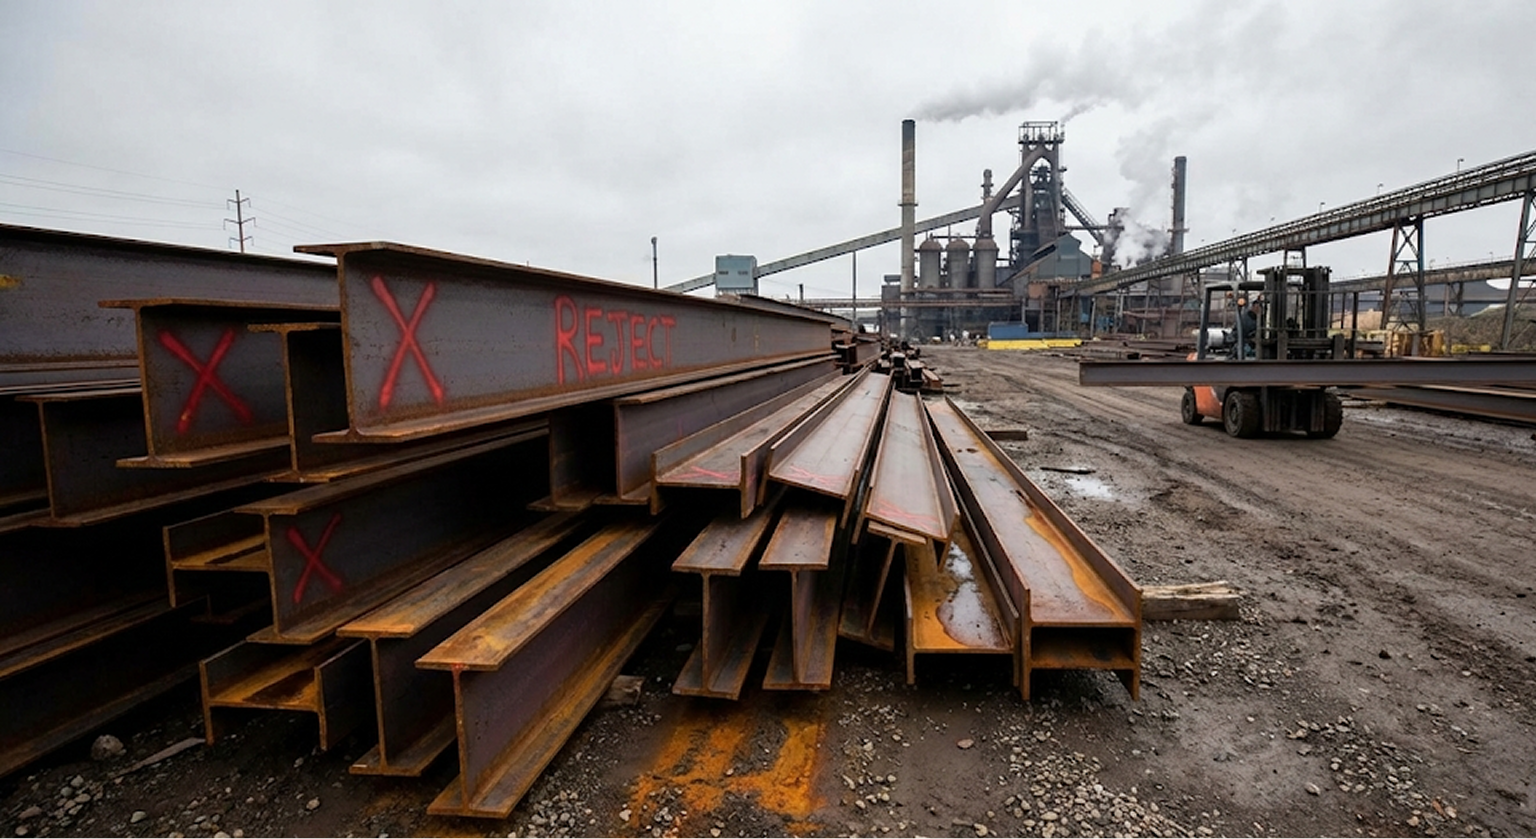
Unlike unit weight, dimensional defects such as tapering, waviness, or width drift are often detected too late, after full-length production is complete.

Challenges
The Blind Spots of Manual Dimensional Inspection
In structural steel production, dimensional accuracy is mission-critical, yet SYS relied heavily on manual, point-based inspection methods for verification. This approach provided limited visibility across the full longitudinal beam profile, meaning defects like tapering, waviness, or shape drift were often detected too late—after full-length production was already complete. Without a continuous digital representation of geometric stability, operators were forced into reactive quality control using averaged data rather than defect-specific conditions. Consequently, undetected gradual drift led to increased batch variability, inconsistent operational standards, and significant material waste when defects were finally discovered post-production.
SYS relied on manual point-based inspection methods for dimensional verification. This created several operational risks:
- Limited visibility across the full longitudinal beam profile
- Delayed detection of tapering or shape drift
- Reactive quality control after production completion
- Inconsistent cross-shift benchmarking
- Root cause investigations based on averaged data rather than defect-specific conditions Dimensional tolerance limits required strict compliance, yet operators lacked a continuous digital representation of geometric stability along the entire beam length.
The result was:
- Undetected gradual drift
- Increased variability between batches
- Material waste when defects were discovered post-production
- Inconsistent operational standards
Solution
Transforming Quality Assurance with Digital Profiling
SYS implemented a Digital Geometric Analytics Engine using Seeq to transform dimensional quality control from reactive inspection to real-time visual intelligence.
01
Historian Integration
By centralizing multiple production data sources—including Leg A and Leg B width measurements, stand torque, tension values, rolling temperature zones, and hydraulic pressures—the team eliminated isolated signal reviews. This comprehensive integration established the foundation for deeply contextualized dimensional analysis.
02
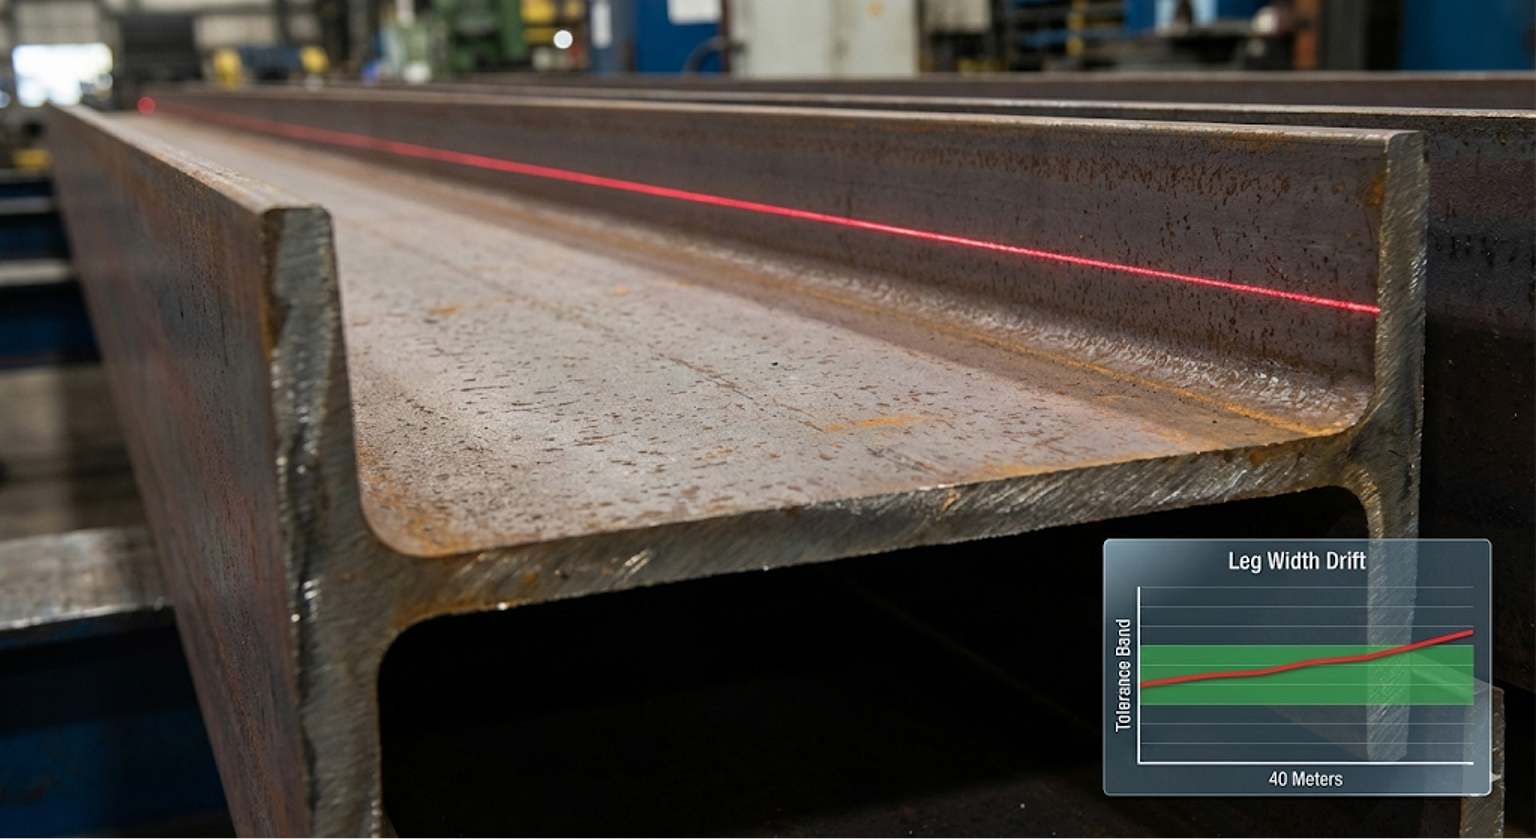
Full-Length Digital Geometric Profiling
The system generated complete longitudinal dimensional trajectories for both legs of the beam, rendering actual width profiles directly against tolerance bands. This fundamental modernization allowed engineers to move past checking isolated points, enabling them to visualize the entire beam geometry digitally and instantly detect tapering, waviness, or progressive drift.
03
Golden Batch Benchmarking
To standardize quality, the system aggregated deviations across all measurement points to calculate a quantitative “Precision Score,” identifying a statistical Golden Batch (Rank 1) for geometric precision. Current batches were then continuously ranked against this baseline, establishing an objective process comparison and standardizing best-in-class operating parameters.
04
Automated Dimensional Root Cause Discovery
Leveraging multivariate and correlation analysis, the system automatically assigned impact scores to upstream process variables, quantifying the correlation strength for engineering validation. By isolating defect-specific conditions—such as a specific torque stand or rolling temperature zone—and mapping them to physical mill sectors, engineers could target corrective actions with unprecedented precision.
05
Self-Service Analytics
Process engineers were empowered to independently develop and refine all models, visualizations, and benchmarking logic within the platform. This eliminated cumbersome spreadsheet-based analysis and established a scalable, engineer-owned capability featuring highly repeatable forensic workflows for continuous improvement.
Benefits
Driving Precision, Quality, and Process Stability

Operational Efficiency
- Detection of geometric drift
- Reduced post-production rejection risk
- Faster root cause identification

Asset & Process Stability
- Clear identification of high impact stands and temperature zones
- Reduced unnecessary broad machine adjustments
- Targeted mechanical calibration

Product Quality & Compliance
- Continuous visualization against tolerance bands
- Standardized benchmark operating conditions
- Reduced variability between batches

Organizational Impact
- Transition from manual point inspection to full digital profiling
- Empowered engineers with self-service multivariate analysis
- Established a standardized precision ranking system
Cost Saving
Mitigating the Cost of Scrap and Rework
Dimensional defects in structural steel production directly translate into costly rework, scrap material, delivery delays, and the risk of customer dissatisfaction. The Digital Geometric Analytics Engine actively reduces this variability and prevents off-spec production, enabling early corrections long before material loss accumulates. For a detailed cost impact model—including scrap reduction rates, rework avoidance, and annualized margin protection—connect with us to review the dimensional quality financial assessment framework.