


OEE & Operational Excellence Through Advanced Industrial Analytics
A leading specialty petrochemical and synthetic elastomer manufacturer, with operations in Thailand and India, produces high-value C4 feedstocks and specialty polymer products.
The company’s portfolio includes:
- 1,3-Butadiene
- Butene-1
- MTBE
- ESBR
- Nitrile Butadiene Latex
- Medical-grade Synthetic Polyisoprene Latex
The manufacturing operations involve high-precision chemical extraction, distillation, stripping, devolatilization, and emulsion polymerization processes.
With narrow operating margins and stringent product-quality requirements—particularly for medical-grade products—the customer sought to improve operational stability, production efficiency, yield, and energy performance using the data already available in its plant historians.
BUSINESS CONTEXT & CHALLENGES
Based on our discovery with the customer, we identified key operational challenges across equipment availability, production performance, product quality, energy consumption, and engineering productivity.
Heat Exchanger & Reboiler Fouling
Butadiene extraction and isoprene distillation equipment are susceptible to polymer deposition on reboiler bundles and coolers. Progressive fouling can reduce process performance, increase energy requirements, and contribute to production-rate derating, reactive cleaning, and lost production during interventions and turnarounds.
The customer needed better visibility into how fouling developed over time, how it affected process performance, and when intervention could be better informed by operating data.
Batch Variability & Off-Specification Product
In emulsion polymerization, variations in temperature and initiator dosing can influence reaction behavior and final product properties.
The customer experienced variability in:
- Molecular weight
- Total Solids Content (TSC)
- Reaction behavior
- Coagulum formation
For products that could not be reprocessed when off specification, this variability translated into direct material and yielded losses.
Stripping & Devolatilization Energy Consumption
Removing residual monomers to stringent product specifications required substantial low-pressure steam consumption.
The customer lacked a dynamic way to compare specific energy consumption across batches and operating conditions, creating opportunities to identify unnecessary over-stripping while maintaining product requirements.
Manual Engineering Analysis
Engineering teams were spending approximately 10–14 hours per week extracting historian data, preparing spreadsheets, and investigating process behavior.
This limited the time available for higher-value engineering activities and introduced delays in identifying recurring process issues.
The customer therefore needed a more repeatable, scalable, and data-driven approach to operational analysis.
SOLUTION
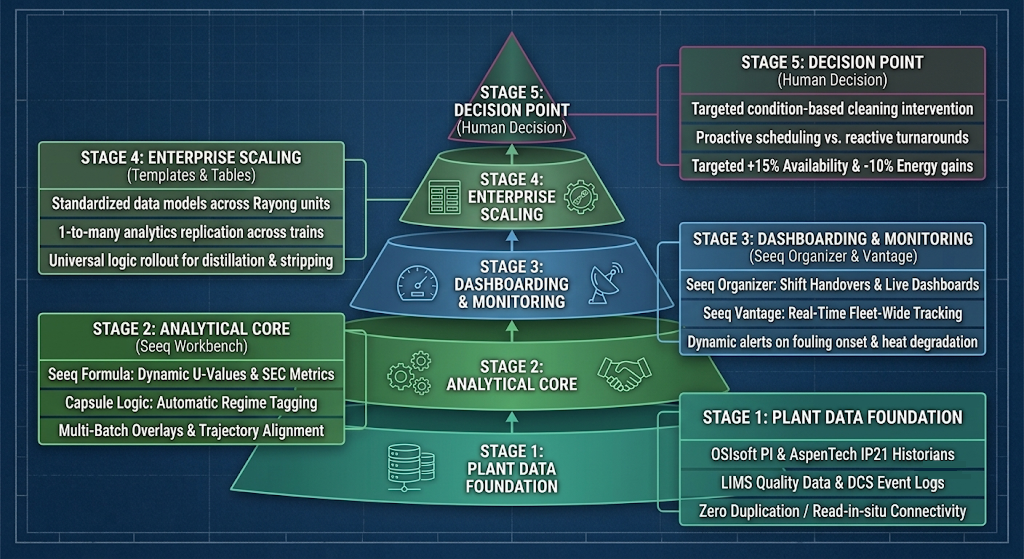
The customer implemented Seeq Advanced Analytics as an operational analytics layer over its existing process historian infrastructure.
Seeq enabled process and reliability SMEs to analyze plant data without requiring the underlying historian data to be duplicated.
The solution leveraged existing data from systems including OSIsoft PI and AspenTech IP21.
Fouling Analysis
Seeq was used to investigate operating behavior associated with heat exchanger and reboiler fouling.
Engineers could compare process behavior across operating periods and examine patterns associated with deterioration in equipment and process performance. This created a data-driven foundation for understanding fouling progression and supporting better-informed cleaning and intervention decisions.
Want to understand how the fouling use case was delivered?
Connect with our Subject Matter Experts to learn how Seeq can be applied to identify fouling behavior, characterize degradation patterns, and support condition-based decision-making.
Batch Analytics
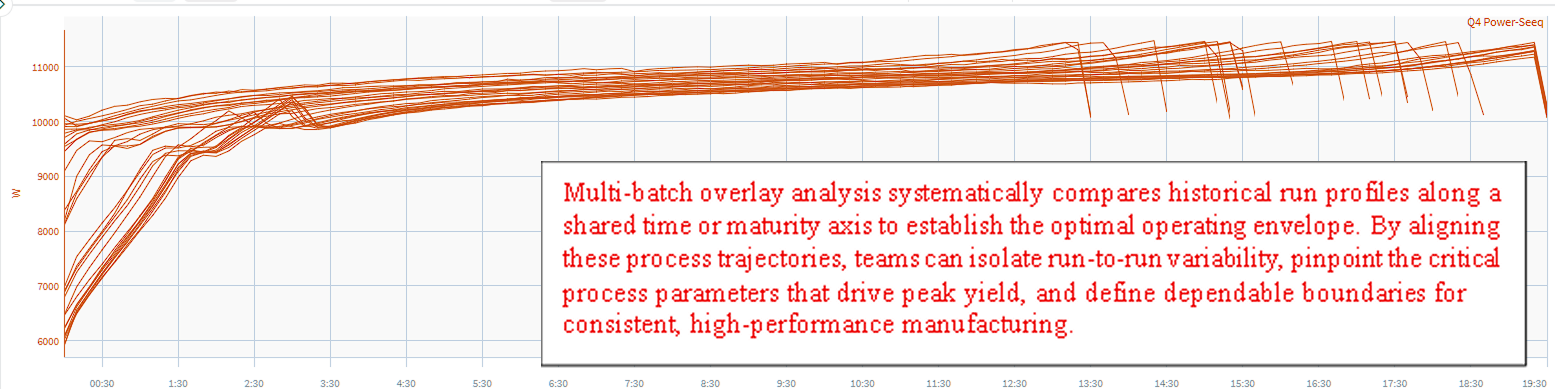
Production batches were analyzed and compared based on their process trajectories.
Engineers investigated relationships between:
- Temperature profiles
- Initiator dosing
- Reaction behavior
- Batch duration
- Final quality
- Off-specification events
This enabled SMEs to distinguish operating characteristics associated with more consistent batch performance.
Energy & SEC Monitoring
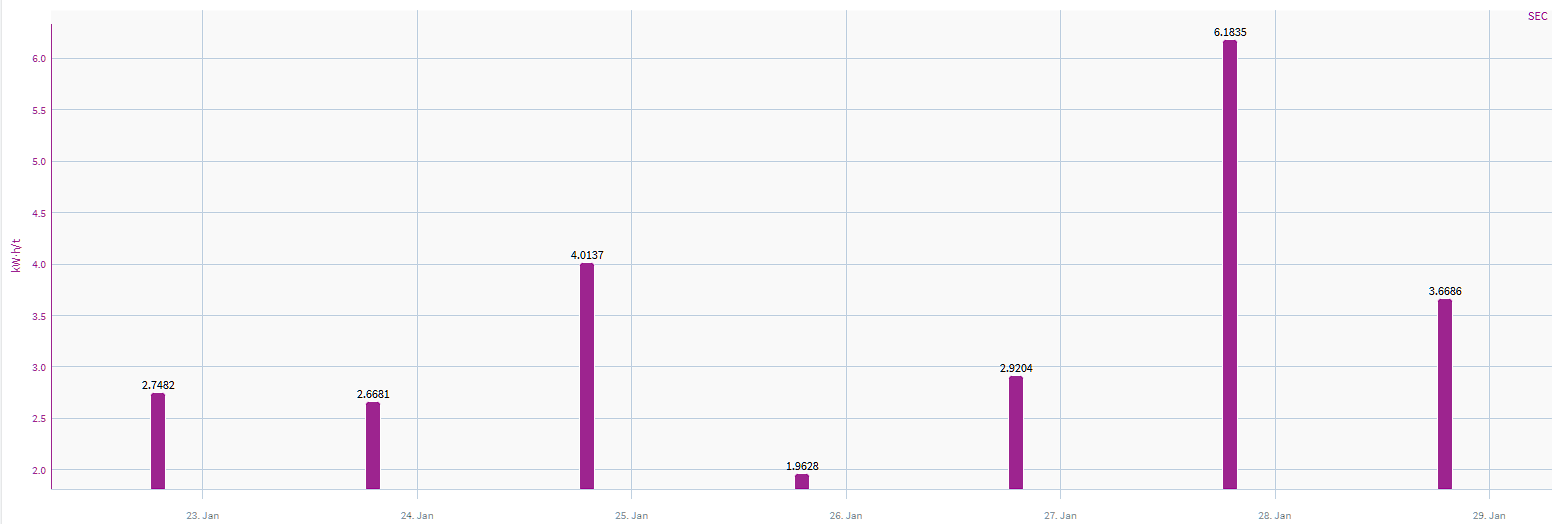
Specific energy consumption was analyzed alongside process and production variables.
This enabled the customer to investigate where steam consumption was higher than expected and identify opportunities to reduce over-stripping while maintaining required product specifications.
Operational Monitoring
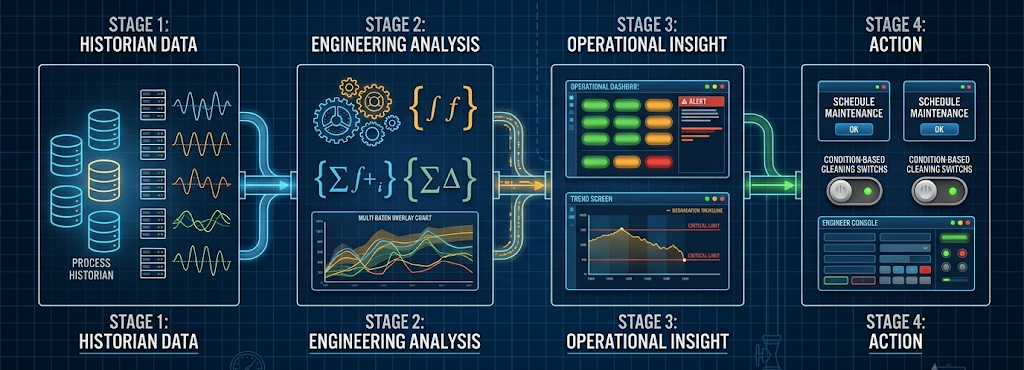
Rather than using Seeq only as an engineering investigation tool, the customer used the analytics to create repeatable operational views and monitoring workflows.
The solution combined process analytics with operational visualization to help teams move from:
Historian Data → Engineering Analysis → Operational Insight → Action
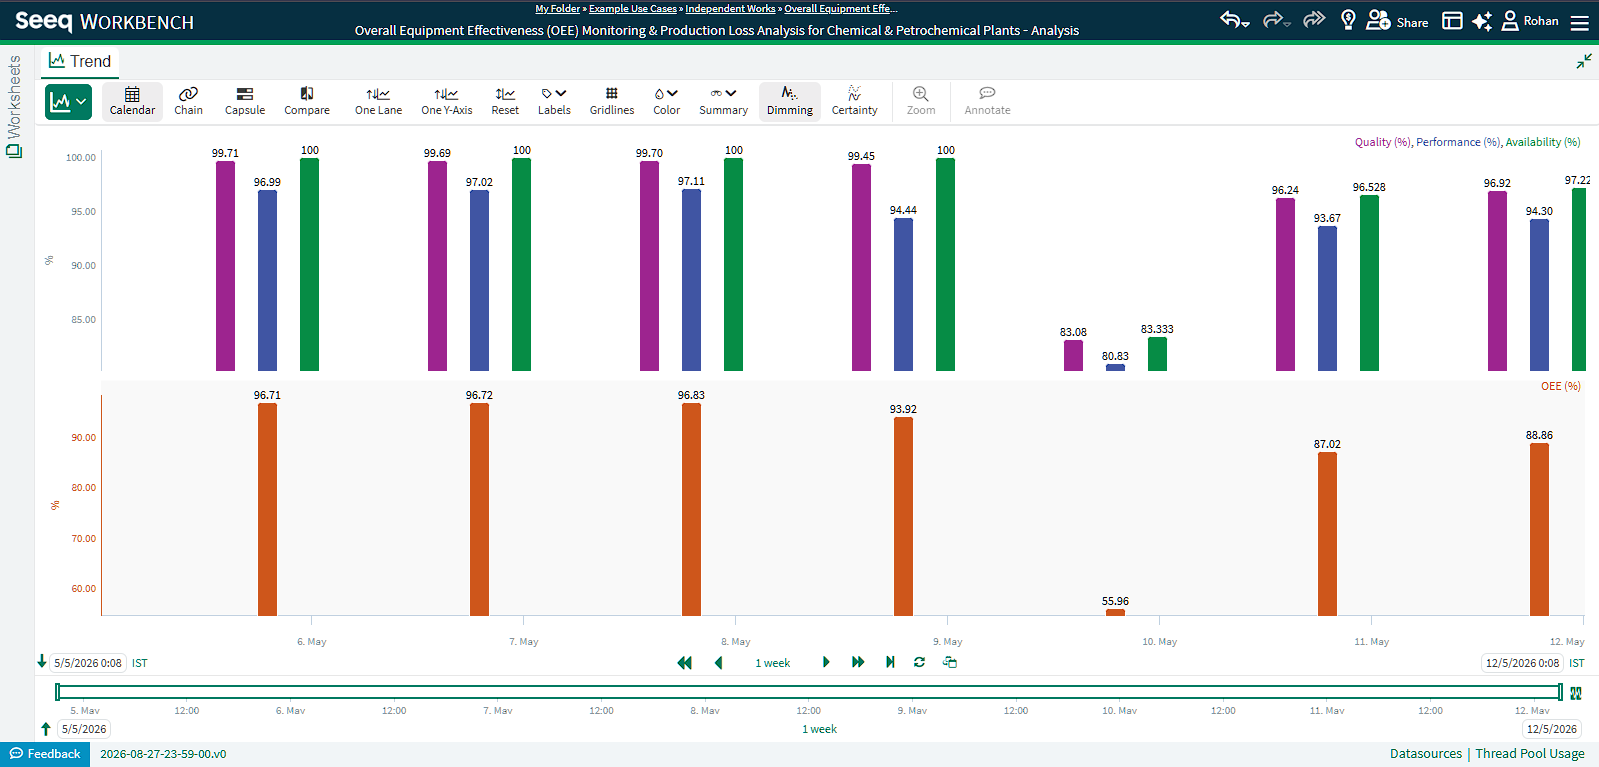
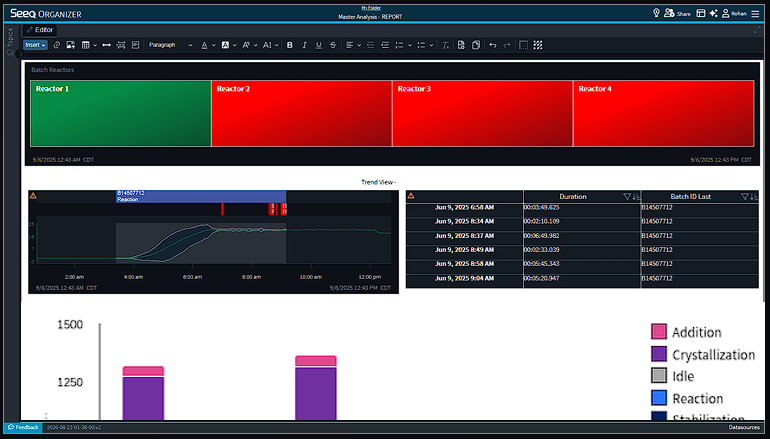
Operational Dashboards
The customer-facing operational views brought together relevant process indicators into a common monitoring environment.
The examples shown in images include:
- Comparative process/operating KPIs
- Batch or unit performance trends
- Equipment/unit status visualization
- Event and operating-period information
- Process trends
- Production phase/activity information
This gave engineers and operations teams a consolidated view of what was happening, where it was happening, and which operating periods required further investigation.
The objective was not simply to display data, but to convert recurring engineering analyses into standardized operational intelligence that could be monitored and reviewed consistently.
Benefits
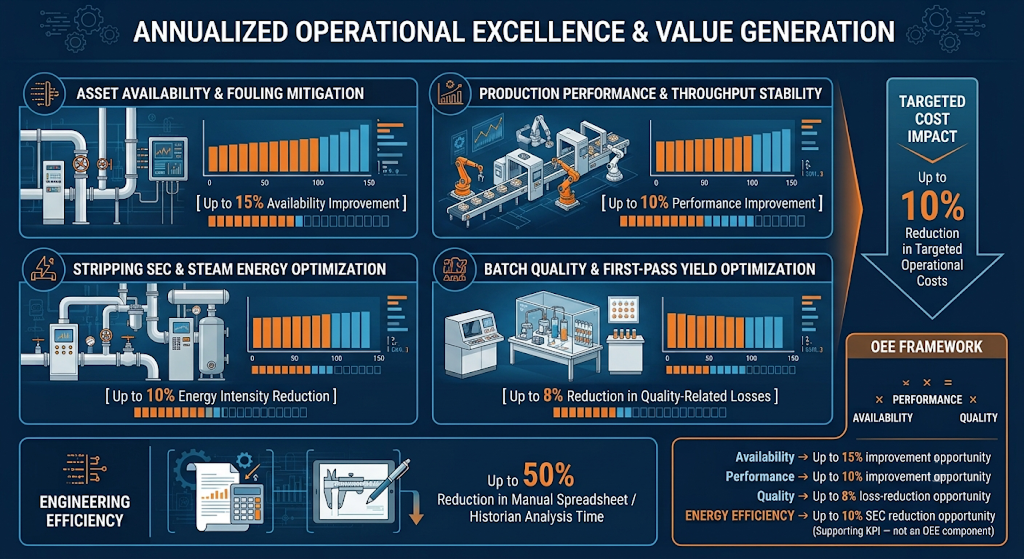
Measurable Improvements Through Advanced Industrial Analytics
Based on the operational challenges identified during customer discovery, the analytics program established a systematic approach to quantify and address losses across availability, production performance, quality, energy consumption, and engineering productivity.
The improvement figures below represent targeted improvement opportunities associated with the identified loss mechanisms, rather than percentage-point increases in OEE. Actual realized improvement is dependent on the customer’s baseline, implementation actions, and sustained operating conditions.
Up to 15% Improvement in Availability
Fouling, cleaning, intervention, and production derating were identified as contributors to availability losses.
Seeq analytics provided visibility into the progression of fouling and its relationship to process performance, enabling the customer to better understand where operating degradation and intervention requirements were occurring.
Up to 10% Improvement in Production Performance
The customer identified production-rate limitations and operating variability as areas where improved operating-regime understanding could support higher effective throughput.
Seeq’s multi-batch and operating-regime analysis was used to compare historical process trajectories and identify conditions associated with stable, high-performance operation. The multi-batch overlay shown in the uploaded case study illustrates how historical runs can be aligned to identify variability and establish an optimal operating envelope.
Up to 8% Reduction in Quality-Related Losses
Batch variability was identified as a contributor to quality-related losses, particularly through variations in temperature, initiator dosing, reaction behavior, TSC, molecular weight, and coagulum formation.
Seeq batch analytics enabled comparisons of successful and unsuccessful production runs to identify operating characteristics associated with more consistent batch performance.
Up to 10% Reduction in Energy Intensity
Stripping and devolatilization were identified as significant steam-consuming operations.
Seeq was used to analyze Specific Energy Consumption (SEC) alongside process and production variables, allowing the customer to identify operating conditions associated with higher-than-expected steam consumption.
Up to 50% Reduction in Engineering Analysis Time
Engineering teams were estimated to spend 10–14 hours per week extracting historian data, preparing spreadsheets, and investigating process behavior.
Seeq replaced portions of this repetitive data-preparation workflow with reusable analytics and monitoring workflows.
Data-Driven OEE Improvement
The combined analytics approach supported the three core dimensions of OEE:
Availability — Up to 15%
Fouling and process-performance data were analyzed over time to identify degradation patterns affecting reboilers, heat exchangers, and production rates. By relating fouling behavior to derating, cleaning, and intervention periods, engineers could identify opportunities for more informed maintenance and operating decisions.
Performance — Up to 10%
Historical production runs were aligned using multi-batch overlay and operating-regime analysis to compare run-to-run variability. This helped engineers identify the process conditions associated with stable, high-performance operation and define a more dependable operating envelope.
Quality — Up to 8%
Successful and unsuccessful batches were compared against their process trajectories, including temperature profiles, initiator dosing, reaction behavior, batch duration, and final quality. This enabled SMEs to identify process conditions associated with more consistent batches and reduce the conditions contributing to off-specification production.
Energy Efficiency — Up to 10%
Steam consumption was analyzed alongside production and process variables using Specific Energy Consumption (SEC). This allowed engineers to identify batches and operating conditions with higher-than-expected steam consumption and investigate opportunities to reduce over-stripping while maintaining product requirements.
COST SAVINGS
Operational variability across fouling, product quality, and energy-intensive stripping can directly impact production capacity, yield, and manufacturing cost. By applying advanced analytics to identify fouling patterns, improve batch consistency, and optimize steam-intensive stripping operations, the customer identified opportunities to reduce avoidable losses and improve overall operational efficiency.
The analytics program identified opportunities for up to 10% reduction in targeted operational costs, driven by improvements in energy efficiency, yield performance, and fouling-related cleaning and turnaround management.
For a detailed cost-saving assessment—including energy reduction modelling, yield and off-specification loss analysis, fouling-related cost assessment, and annualized financial impact—connect with us to review the structured financial impact framework for operational excellence and OEE optimization.